Interactions within the interface
The general frequency of salt bridges, H-bonds, Non-bonded contacts and buried surface area in a protein:protein interface were generated using a database of 243 protein; compared with which are the interactions between the interfaces of CTF3.
CTF3:MCM16 in light-magenta, CTF3:MCM22 in tv-red, CTF3:IML3 in purple blue, CTF3:CTF19 in deepteal.
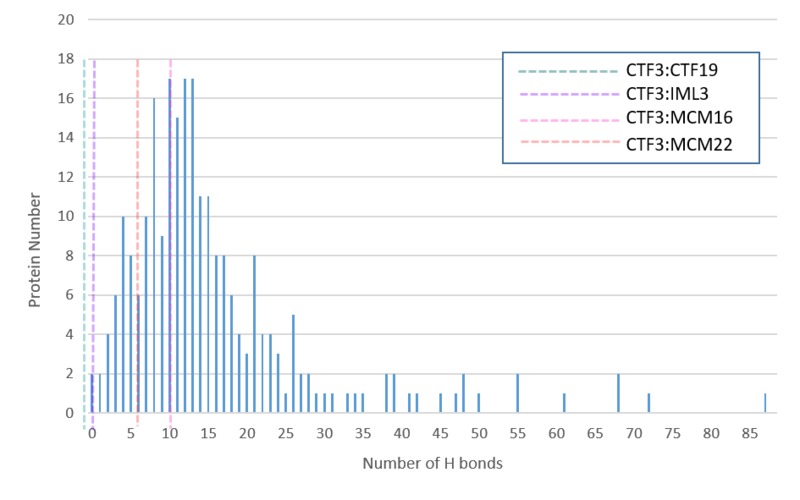
General H-bond frequency
Number of H-bonds between CTF3:CTF19, CTF3:IML3 and CTF3:MCM22 are below the average range, while those between CTF3:MCM16 are within the average range.
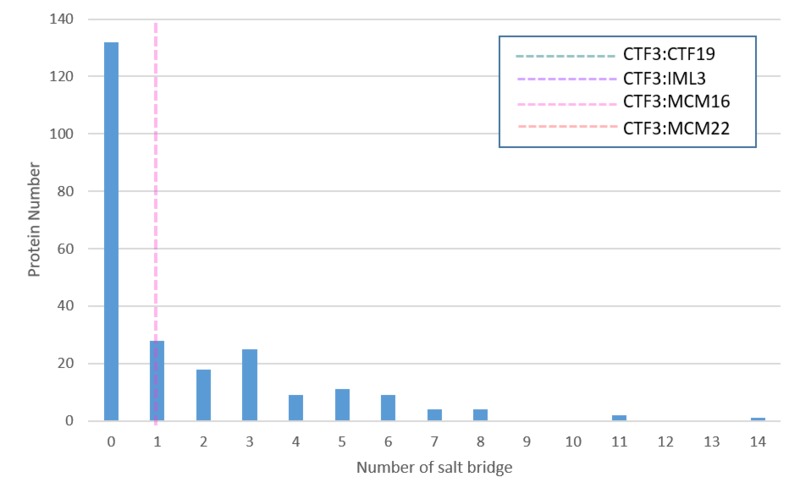
General salt-bridge frequency
One salt bridge is present between CTF3:MCM16, which exceeds that of most protein interfaces which have no salt bridge.
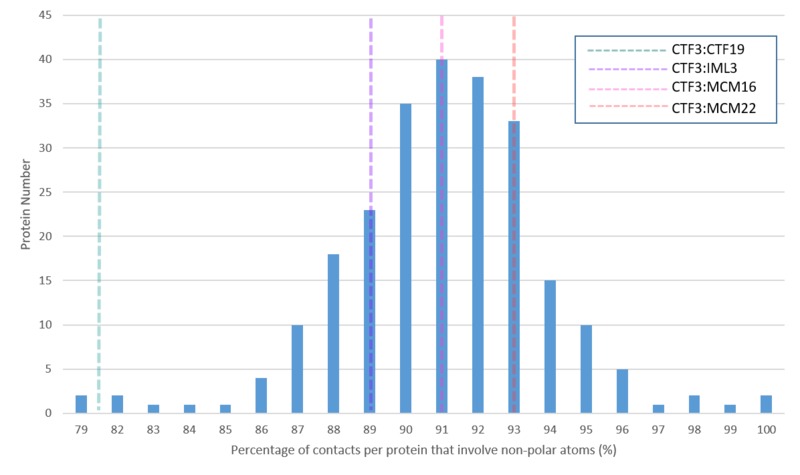
General non-bonded contact frequency
Percentage of Non-bonded contacts in the CTF3:IML3, CTF3:MCM16 and CTF3:MCM22 interface lie within the normal range while those in the CTF3:CTF19 interface are far below the average level.
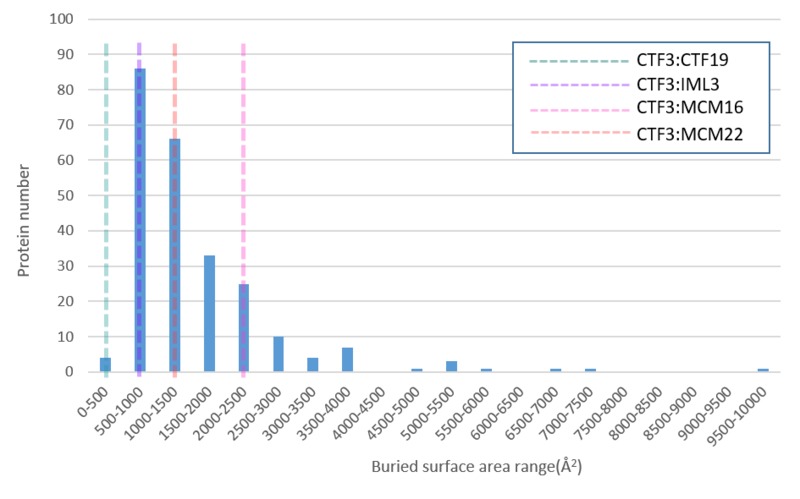
General buried surface area (BSA) frequency
BSA between CTF3:IML and CTF3:MCM22 lies within the average range. BSA between CTF3:MCM16 exceeds the average range, while that between CTF3:CTF19 is far less than that of most proteins.
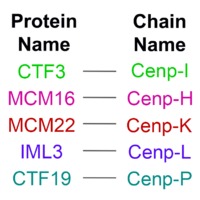
A colour-coded list of protein names and their corresponding chain names.
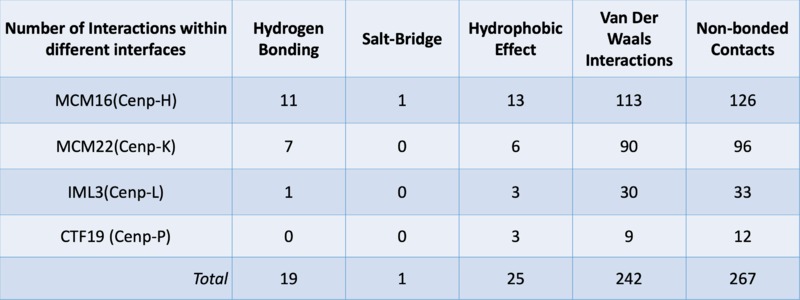
Numbers of interactions in different interfaces
As a summary, this table demonstrates the frequency of hydrogen bonds, Van der Waals (VDW) interactions, salt-bridges and hydrophobic effect in the four interfaces. Clearly, VDW interactions comprise the largest share of non-bonded contacts in each interface.
*The data for the first two types of interactions (H-bonding and salt-bridge) are obtained from Pymol and the remaining are obtained using PDBsum.
*Databases as data source: PDBePISA(entry: 6qld), PDBsum, PDB(entry: 6QLD)